Lucky us, we have a math specialist guest posting today! Read her post to find out how to implement one of the trickier Common Core data standards.

In the Common Core, there is a measurement and data standard (MD.B) that I don’t see being addressed in many programs at the third, fourth, and fifth grade levels. It is all about students constructing and using line plots to further their understanding of fractions. I love how closely this data standard is tied into the fraction knowledge required at each grade level, and it is a great way to incorporate fractions, measurement, and data at the same time.
Here are the standards to which I am referring:
Grade 3: CCSS.Math.Content.3.MD.B.4 Generate measurement data by measuring lengths using rulers marked with halves and fourths of an inch. Show the data by making a line plot, where the horizontal scale is marked off in appropriate units — whole numbers, halves, or quarters.
Grade 4: CCSS.Math.Content.4.MD.B.4 Make a line plot to display a data set of measurements in fractions of a unit (1/2, 1/4, 1/8). Solve problems involving addition and subtraction of fractions by using information presented in line plots. For example, from a line plot find and interpret the difference in length between the longest and shortest specimens in an insect collection.
Grade 5: CCSS.Math.Content.5.MD.B.2 Make a line plot to display a data set of measurements in fractions of a unit (1/2, 1/4, 1/8). Use operations on fractions for this grade to solve problems involving information presented in line plots. For example, given different measurements of liquid in identical beakers, find the amount of liquid each beaker would contain if the total amount in all the beakers was redistributed equally.
These standards have great connections to science and would be easy to incorporate the data collection and line-plot-making into multiple science units.
I want to take you into my classroom for a look at how I am addressing this standard with a group of fifth and sixth grade students.
A Look Inside My Classroom
I wanted my fifth and sixth grade students to be measuring and making a line plot to the nearest eighth of an inch. Because I wanted our first attempt at this to be manageable in size, I chose to have us measure crayons. The reason for this is because when you are going to the eighth of an inch, you don’t want too much spread in your data because it makes the line plot really long. I had two students grab a handful of crayons out of our class bin, and then we passed out rulers. The rulers in this room are marked in sixteenths. Before I sent kids out to measure, we drew a quick diagram on the board and reviewed how to measure to the nearest eight of an inch.

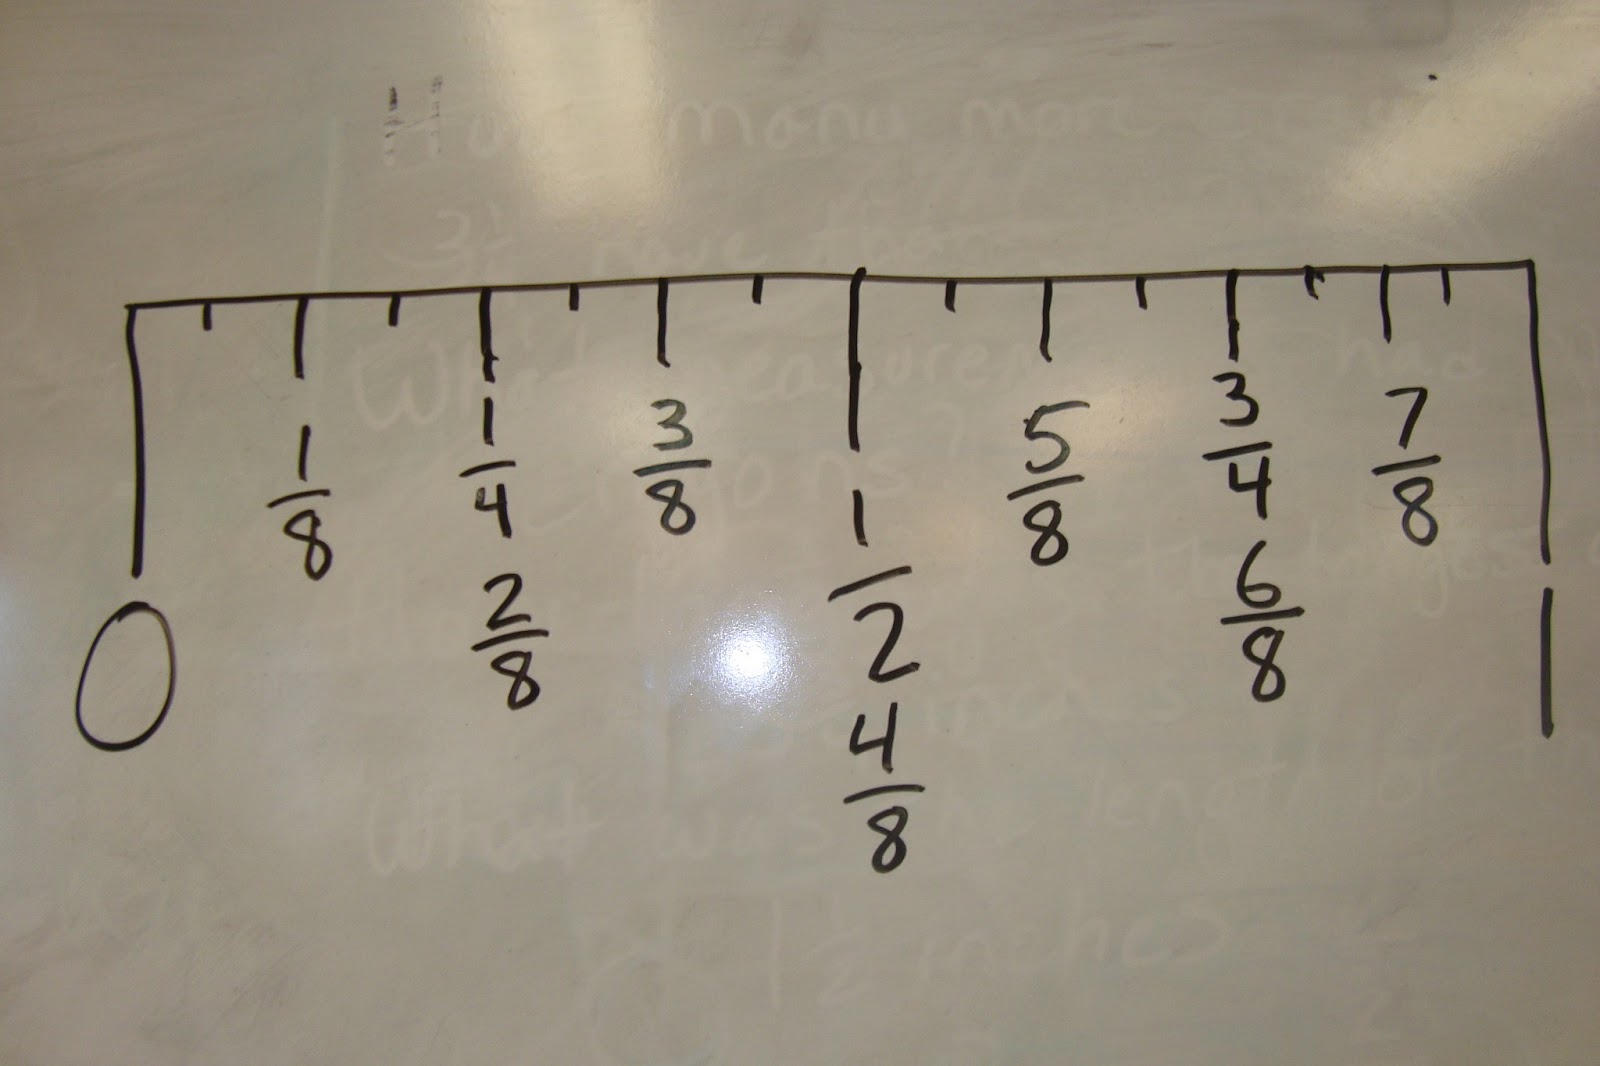
Our quick sketch about how to measure to the nearest eight of an inch and what to do with the sixteenths.
The kids were then put in groups and given a small pile of crayons to measure. They had to agree on the measurements as a group and recorded them on a piece of scrap paper. When everyone was done measuring, we talked about how to draw our line plot and what numbers needed to be on it. It was a great discussion about how small and how large we needed to go and what the increments would be. Students worked with their groups to place their data on the line plot and had a great discussion about how large to make the X marks and how making marks of different sizes would change how the graph looked.

A look at the finished product! As you can see, the students marked it in eights but only labeled the fourths. They tried labeling each eighth at one point but the numbers looked too “squished.”
When the line plot was finished, it was our cue to begin a great discussion about our data. Here is where the strong connections to fractional thinking came into play.
I started by asking kids what they noticed about the line plot and what questions they could think of to ask their peers about the data. This resulted in a quite a few questions that I tried to put into different categories.
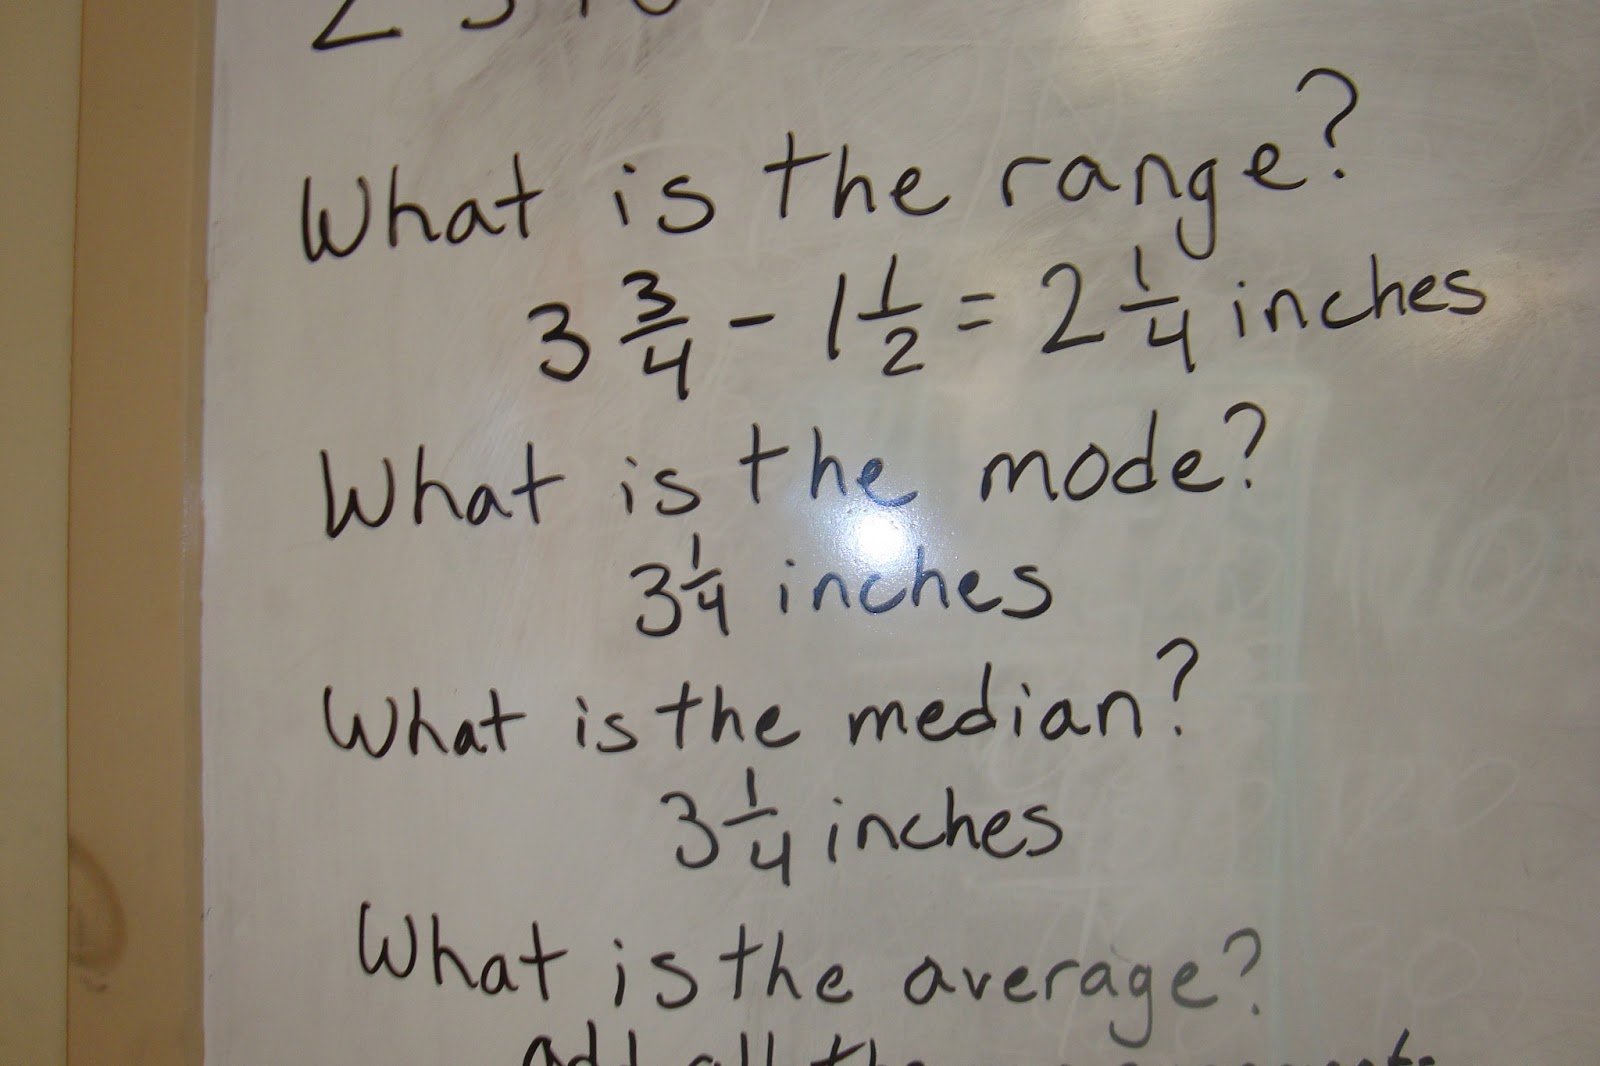
Because there are some sixth graders in this group, and because we have been working on measures of center and other statistics with the group recently, the first set of questions they came up with were statistics-type questions. Here is a peek at a few:

The kids asked and answered each other’s questions about the statistics visible on the line plot. The group decided that finding the average (mean) would be quite a bit of work and were happy to say that the answer would be “a little more than three.”
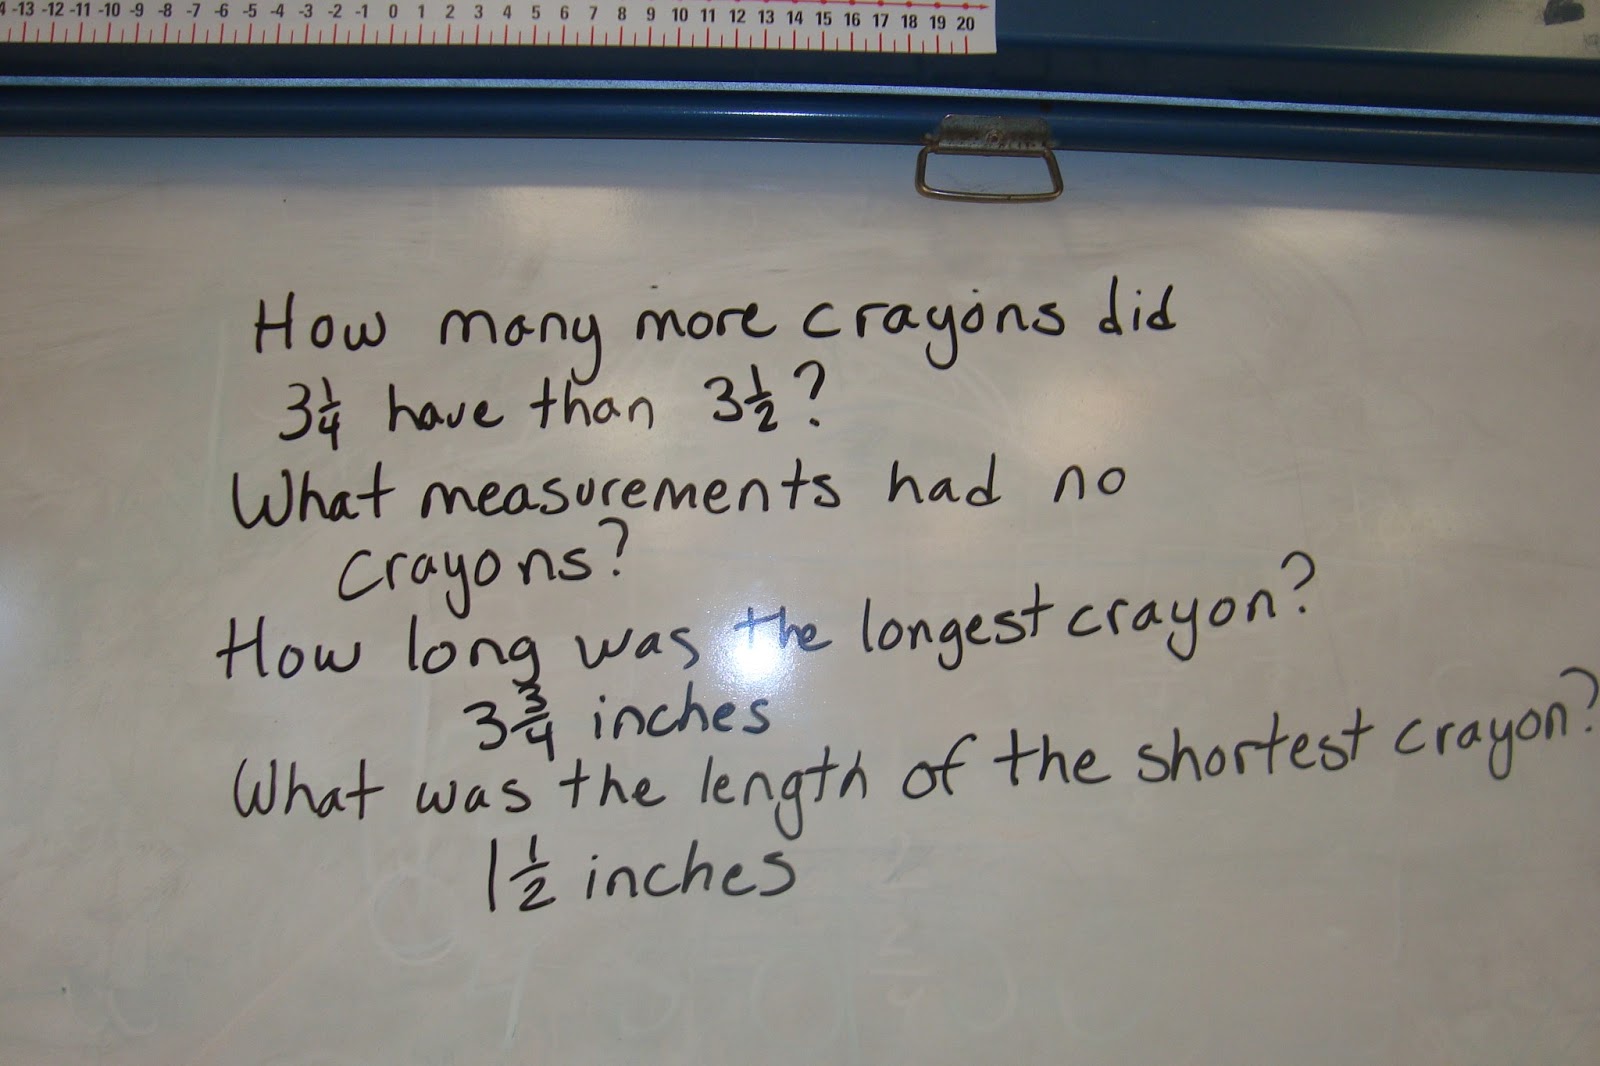
These statistics questions are great for the sixth graders but not really what the Common Core standards I was hoping to address were about. So, we tried some more questions. Many of these questions fell under the category of interpreting the representation. While they were great, it was still not the type of questions referred to in the Common Core standards.

These questions fell under the category of general representation interpretation. I could tell from these questions that my students know how to interpret a line plot.
I think the reason that my students didn’t come up with the questions I was looking for was because they have never been asked to use a line plot in this way. After I asked a few questions, they got the idea and helped me generate a few more. Here is a list of the questions we came up with that really get at the Common Core standards.
- How much longer was the longest crayon than the shortest one?
- If we put all the crayons that are three-and-a-quarter inches in a line, then how long would that line be?
- Are there any two crayons that could be put end-to-end and be the same length as another crayon?
- Which line would be longer: all of the three-and-one-eighth-inch crayons lying end-to-end or all of the three-and-three-quarter-inch crayons lying end-to-end? How much longer would one line be than the other?
These questions ended up being a great review of the fraction operations on which we have been working. Also, I was surprised how easy some of the questions ended up being for some of my students who struggle the most. The number line model really supported my students’ thinking. I really like the way this standard integrated several different things on which we had been working. I can’t wait to share this lesson with the science teachers and see how they can incorporate this standard into their own lessons. How do you plan on meeting this common core standard?
Tara, aka The Math Maniac, is a K-6 math specialist from a small town in Vermont. She loves learning about how her students think about math and is always impressed with the ways students can invent math for themselves. You can find her on Pinterest, on Teachers Pay Teachers, and on her blog, The Math Maniac.